Page 89 - 台玻集團2019 CSR英文版
P. 89

2019 Corporate Sustainability Report       TAIWANGLASS


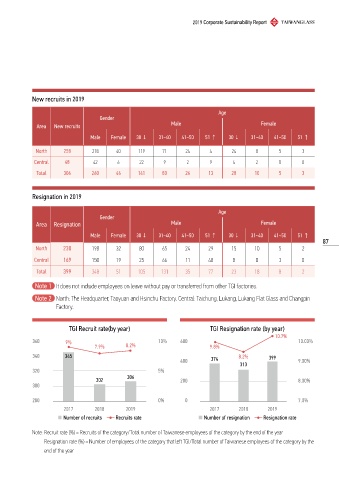
            New recruits in 2019

                                                                              Age
                                    Gender
              Area  New recruits                             Male                            Female
                                 Male   Female   30 ö    31~40   41~50   51 õ    30 ö    31~40   41~50    51 õ

              North    258       218      40      119     71      24       4      24       8       5       3

             Central    48        42      6       22      9        2       9       4       2       0       0
              Total    306       260      46     141      80      26      13      28      10       5       3


            Resignation in 2019


                                                                              Age
                                    Gender
              Area  Resignation                              Male                            Female

                                 Male   Female   30 ö    31~40   41~50   51 õ    30 ö    31~40   41~50    51 õ
                                                                                                                  87
              North    230       198      32      80      65      24      29      15      10       5       2
             Central   169       150      19      25      66      11      48       8       8       3       0

              Total    399       348      51     105      131     35      77      23      18       8       2

              Note 1   It does not include employees on leave without pay or transferred from other TGI factories.

              Note 2   North: The Headquarter, Taoyuan and Hsinchu Factory. Central: Taichung, Lukang, Lukang Flat Glass and Changpin
                     Factory.


                         TGI Recruit rate(by year)                         TGI Resignation rate (by year)
                                                                                                  10.7%
            360         9%                               10%    600                                       10.00%
                                  7.9%       8.2%                          9.8%
            340         345                                                          8.2%      399
                                                                400        374                            9.00%
                                                                                     313
            320                                          5%
                                              306
                                   302                          200                                       8.00%
            300

            280                                          0%       0                                       7.0%
                       2017       2018       2019                          2017      2018      2019
                     ¾ Number of recruits       Recruits rate          ¾ Number of resignation       Resignation rate

            Note:  Recruit rate (%) = Recruits of the category/Total number of Taiwanese employees of the category by the end of the year
                   Resignation rate (%) = Number of employees of the category that left TGI/Total number of Taiwanese employees of the category by the
                 end of the year
   84   85   86   87   88   89   90   91   92   93   94