
Page 86 - 台玻集團2019 CSR英文版
P. 86
Ch1 CH2 CH3 CH4 CH5 CH6
Sustainability Steady Operation, Excellent Service Quality Sustainable Safe Workplace Social and
Communication Integrity Governance & Innovative Products Operation & Trusted Growth Community Care
Our compensations and benefits are better than the compliance requirement and continuously adjusted based on employee's position
and personal experience instead of gender, race, religion, political affiliation, marital status or union/social association membership.
In addition to providing a starting salary that is higher than the legal minimum wage in the areas where TGI operates, we also review
employee's education level, experience, expertise, skills, number of years of service in the industry and the average salary in the industry.
All management systems and rules were formulated with compliance with the Labor Standards Act and other regulations. Various levels of
managers assist employees inside and outside the company, the overall labor relations are harmonious.
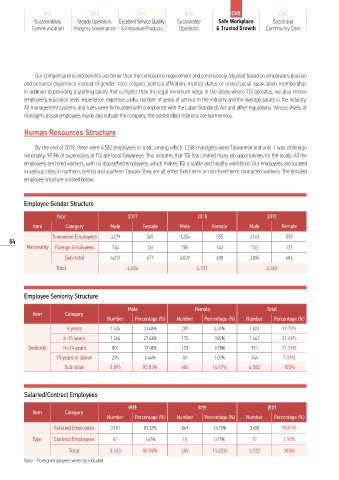
Human Resources Structure
By the end of 2019, there were 4,582 employees in total, among which 1,268 managers were Taiwanese and only 1 was of foreign
nationality. 99.9% of supervisors at TGI are local Taiwanese. This indicates that TGI has created many job opportunities for the locals. All the
employees are hired workers, with no dispatched employees, which makes TGI a stable and healthy workforce. Our employees are located
in various cities in northern, central and southern Taiwan. They are all either fixed-term or non-fixed-term contracted workers. The detailed
employee structure is listed below:
Employee Gender Structure
Year 2017 2018 2019
Item Category Male Female Male Female Male Female
Taiwanese Employees 3,279 545 3,254 555 3,163 559
84
Nationality Foreign Employees 734 126 785 143 733 127
Sub-total 4,013 671 4,039 698 3,896 686
Total 4,684 4,737 4,582
Employee Seniority Structure
Male Female Total
Item Category
Number Percentage (%) Number Percentage (%) Number Percentage (%)
5 years 1,534 33.48% 289 6.31% 1,823 39.79%
6~15 years 1,266 27.63% 175 3.82% 1,441 31.45%
Seniority 16~24 years 801 17.48% 173 3.78% 974 21.26%
25 years or above 295 6.44% 49 1.07% 344 7.51%
Sub-total 3,896 85.03% 686 14.97% 4,582 100%
Salaried/Contract Employees
Ӳ ɾ Υࠇ
Item Category
Number Percentage (%) Number Percentage (%) Number Percentage (%)
Salaried Employees 3,101 83.32% 549 14.75% 3,650 98.07%
Type Contract Employees 62 1.67% 10 0.27% 72 1.93%
Total 3,163 84.98% 559 15.02% 3,722 100%
NotejForeignemployees were not included.