
Page 83 - 台玻集團2019 CSR英文版
P. 83
2019 Corporate Sustainability Report TAIWANGLASS
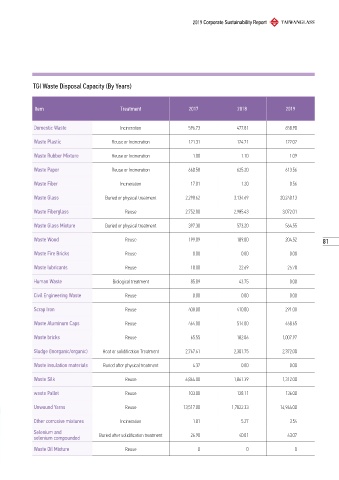
TGI Waste Disposal Capacity (By Years)
Item Treatment 2017 2018 2019
Domestic Waste Incineration 596.73 477.81 658.90
Waste Plastic Reuse or Incineration 121.31 124.71 122.02
Waste Rubber Mixture Reuse or Incineration 1.00 1.10 1.09
Waste Paper Reuse or Incineration 660.58 625.20 613.56
Waste Fiber Incineration 17.01 1.20 0.56
Waste Glass Buried or physical treatment 2,298.62 3,134.69 20,240.13
Waste Fiberglass Reuse 2,752.00 2,985.43 3,072.01
Waste Glass Mixture Buried or physical treatment 397.30 573.20 564.55
Waste Wood Reuse 199.09 189.00 204.52 81
Waste Fire Bricks Reuse 0.00 0.00 0.00
Waste lubricants Reuse 18.00 22.69 25.78
Human Waste Biological treatment 85.89 43.75 0.00
Civil Engineering Waste Reuse 0.00 0.00 0.00
Scrap Iron Reuse 408.00 410.00 291.00
Waste Aluminum Caps Reuse 464.00 514.00 468.65
Waste bricks Reuse 65.55 182.06 1,007.97
Sludge (Inorganic/organic) Heat or solidification Treatment 2,767.61 2,301.75 2,372.00
Waste insulation materials Buried after physical treatment 4.37 0.00 0.00
Waste Silk Reuse 6,864.00 1,861.39 1,312.00
waste Pallet Reuse 103.00 128.11 136.00
Unwound Yarns Reuse 13,517.00 1,7822.33 14,964.00
Other corrosive mixtures Incineration 1.81 5.27 3.54
Selenium and
selenium compounded Buried after solidification treatment 26.90 40.01 63.07
Waste Oil Mixture Reuse 0 0 0