
Page 124 - 2017台玻CSR_英文_全含封面1002 (1)
P. 124
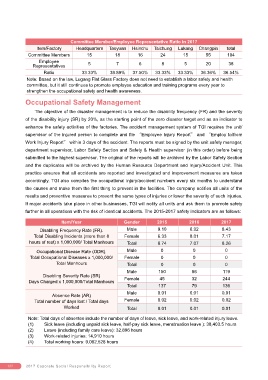
Committee Member/Employee Representative Ratio in 2017
                 Item/Factory      Headquarters   Taoyuan   Hsinchu  Taichung   Lukang   Changpin     total
              Committee Members         15          18        16        24        15        55        104
                  Employee
                Representatives         5            7         6         8         5        20         38
                    Ratio            33.33%       38.89%    37.50%    33.33%    33.33%    36.36%    36.54%
             Note: Based on the law, Lugang Flat Glass Factory does not need to establish a labor safety and health
             committee, but it still continues to promote employee education and training programs every year to
             strengthen the occupational safety and health awareness.

            Occupational Safety Management

                The objective of the disaster management is to reduce the disability frequency (FR) and the severity
            of the disability injury (SR) by 20%, as the starting point of the zero disaster target and as an indicator to
            enhance the safety activities of the factories. The accident management system of TGI requires the unit/
            supervisor of the injured person to complete and file ¨Employee Injury Report© and ¨Employ to/from
            Work Injury Report© within 3 days of the accident. The reports must be signed by the unit safety manager,

            department supervisor, Labor Safety Section and Safety & Health supervisor (in this order) before being
            submitted to the highest supervisor. The original of the reports will be archived by the Labor Safety Section
            and the duplicates will be archived by the Human Resource Department and Injury/Accident Unit. This
            practice ensures that all accidents are reported and investigated and improvement measures are taken
            accordingly. TGI also compiles the occupational injury/accident numbers every six months to understand
            the causes and make them the first thing to prevent in the facilities. The company notifies all units of the
            results and preventive measures to prevent the same types of injuries or lower the severity of such injuries.

            If major accidents take place in other businesses, TGI will notify all units and ask them to promote safety
            further in all operations with the risk of identical accidents. The 2015-2017 safety indicators are as follows:

                            Item/Year                   Gender         2015          2016          2017
                   Disabling Frequency Rate (FR).        Male          9.10          6.92           8.43
                Total Disabling Incidents (more than 8   Female        6.33          8.01           7.17
              hours of rest) x 1,000,000/ Total Manhours  Total        8.74          7.07           8.26

                 Occupational Disease Rate (ODR).        Male            0             0             ō
              Total Occupational Diseases x 1,000,000/   Female          0             0             ō
                          Total Manhours                  Total          0             0             ō
                                                         Male          150            86            119
                    Disabling Severity Rate (SR)
              Days Charged x 1,000,000/Total Manhours   Female          45            32            244
                                                          Total        137            79            136
                                                         Male          0.01          0.01           0.01
                        Absence Rate (AR)
                Total number of days lost / Total days   Female        0.02          0.02           0.02
                             Worked                       Total        0.01          0.01           0.01

             Note: Total days of absentee include the number of days of leave, sick leave, and work-related injury leave.
             (1)     Sick leave (including unpaid sick leave, half-pay sick leave, menstruation leave ): 38,403.5 hours
             (2)     Leave (including family care leave): 32,896 hours
             (3)     Work-related injuries: 14,910 hours
             (4)     Total working hours: 9,082,528 hours


    122      2017 Coporate Social Responsibility Report