
Page 73 - 台玻集團2019 CSR英文版
P. 73
2019 Corporate Sustainability Report TAIWANGLASS
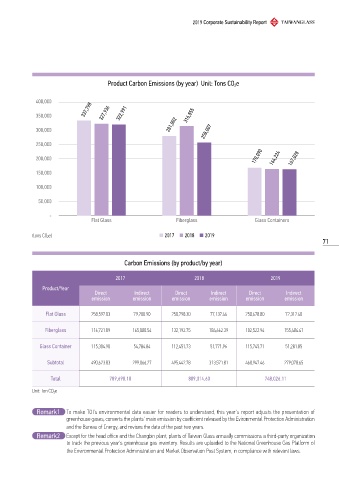
Product Carbon Emissions (by year) Unit: Tons CO 2e
400,000
337,798
350,000 327,936 322,991 316,855
300,000 281,802 258,007
250,000
170,090
200,000 164,224 167,028
150,000
100,000
50.000
-
Flat Glass Fiberglass Glass Containers
(tons CO 2e) ¾ 2017 ¾ 2018 ¾ 2019
71
Carbon Emissions (by product/by year)
2017 2018 2019
Product/Year
Direct Indirect Direct Indirect Direct Indirect
emission emission emission emission emission emission
Flat Glass 258,597.03 79,200.90 250,798.30 77,137.46 250,678.80 72,312.40
Fiberglass 116,721.89 165,080.54 132,192.75 184,662.39 102,522.94 155,484.41
Glass Container 115,304.90 54,784.84 112,451.73 51,771.96 115,745.71 51,281.85
Subtotal 490,623.83 299,066.27 495,442.78 313,571.81 468,947.46 279,078.65
Total 789,690.10 809,014.60 748,026.11
Unit: Ton CO 2e
Remark1 To make TGI's environmental data easier for readers to understand, this year's report adjusts the presentation of
greenhouse gases, converts the plants' main emission by coefficient released by the Evironmental Protection Administration
and the Bureau of Energy, and revises the data of the past two years.
Remark2 Except for the head office and the Changbin plant, plants of Taiwan Glass annually commissions a third-party organization
to track the previous year's greenhouse gas inventory. Results are uploaded to the National Greenhouse Gas Platform of
the Environmental Protection Administration and Market Observation Post System, in compliance with relevant laws.