
Page 72 - 台玻集團2019 CSR英文版
P. 72
Ch1 CH2 CH3 CH4 CH5 CH6
Sustainability Steady Operation, Excellent Service Quality Sustainable Safe Workplace Social and
Communication Integrity Governance & Innovative Products Operation & Trusted Growth Community Care
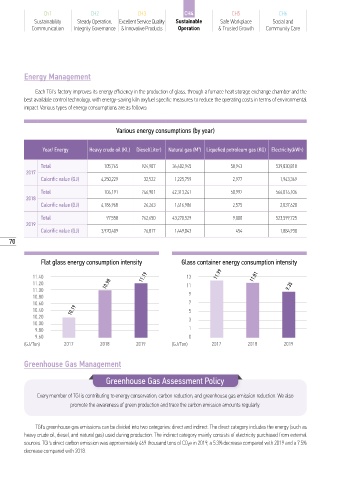
Energy Management
Each TGI's factory improves its energy efficiency in the production of glass, through a furnace heat storage exchange chamber and the
best available control technology, with energy-saving kiln oxyfuel specific measures to reduce the operating costs in terms of environmental
impact. Various types of energy consumptions are as follows:
Various energy consumptions (by year)
3
Year/ Energy Heavy crude oil (KL) Diesel(Liter) Natural gas (M ) Liquefied petroleum gas (KG) Electricity(kWh)
Total 105,765 924,907 36,602,945 58,943 539,830,818
2017
Calorific value (GJ) 4,250,229 32,522 1,225,759 2,977 1,943,369
Total 104,191 746,901 42,313,241 50,997 566,014,106
2018
Calorific value (GJ) 4,186,968 26,263 1,416,986 2,575 2,037,628
Total 97,558 762,650 43,270,529 9,000 523,599,725
2019
Calorific value (GJ) 3,920,409 26,817 1,449,043 454 1,884,938
70
Flat glass energy consumption intensity Glass container energy consumption intensity
11.40 11.19 13 11.99 11.81
11.20 10.98 11 9.35
11.00
10.80 9
10.60 7
10.40 10.19 5
10.20 3
10.00
9.80 1
9.60 0
(GJ/Ton) 2017 2018 2019 (GJ/Ton) 2017 2018 2019
Greenhouse Gas Management
Greenhouse Gas Assessment Policy
Every member of TGI is contributing to energy conservation, carbon reduction, and greenhouse gas emission reduction. We also
promote the awareness of green production and trace the carbon emission amounts regularly.
TGI's greenhouse gas emissions can be divided into two categories: direct and indirect. The direct category includes the energy (such as
heavy crude oil, diesel, and natural gas) used during production. The indirect category mainly consists of electricity purchased from external
sources. TGI's direct carbon emission was approximately 469 thousand tons of CO 2e in 2019, a 5.3% decrease compared with 2019 and a 7.5%
decrease compared with 2018.