
Page 88 - 2018台玻csr英文1022
P. 88
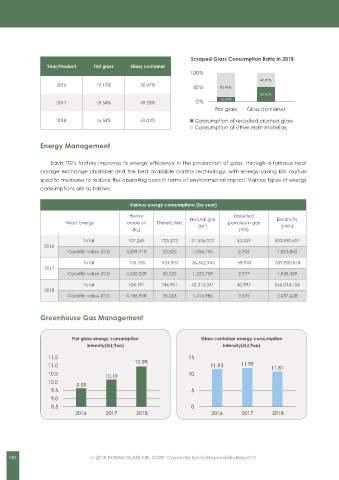
Scraped Glass Consumption Ratio in 2018 Greenhouse Gas Assessment Policy
Year/Product Flat glass Glass container
100Ĉ Every member of TGI is contributing to energy conservation, carbon reduction, and
49.97Ĉ greenhouse gas emission reduction. We also promote the awareness of green production
2016 19.10% 50.47% 50Ĉ 83.46Ĉ Leadership CH.1 Sustainable Glass
and trace the carbon emission amounts regularly.
50.03Ĉ
2017 18.54% 49.28% 0Ĉ 16.54Ĉ
Flat glass Glass container TGI' greenhouse gas emissions can be divided into two categories: direct and indirect. The direct
category includes the energy (such as heavy crude oil, diesel, and natural gas) used during production.
2018 16.54% 50.03% Consumption of recycled crushed glass
Consumption of other main materials The indirect category mainly consists of the electricity purchased from external sources. TGI's direct carbon
emission was approximately 500 thousand tons of CO2e in 2018, 1.11% higher than 2017. CH.2 Ethical
Energy Management Product Carbon Emissions (by year)
Unit: Ton CO 2 e Operation
Each TGI's factory improves its energy efficiency in the production of glass, through a furnace heat 2016 2017 2018
storage exchange chamber and the best available control technology, with energy-saving kiln oxyfuel Product/
Indirect
Direct
Indirect
Direct
Direct
Indirect
specific measures to reduce the operating costs in terms of environmental impact. Various types of energy Year emission emission emission emission emission emission
consumptions are as follows: CH.3 Quality
Flat Glass 270,231 78,989 258,466 75,619 250,686 73,657
Various energy consumptions (by year) Fiberglass 103,279 134,193 116,730 157,639 132,188 176,329 Management
Heavy Liquefied Glass
Year/ Energy crude oil Diesel(Liter) Natural gas petroleum gas Electricity Container 111,278 52,851 114,708 52,313 112,460 49,436
(M )
(kWh)
3
(KL) (KG)
Subtotal 484,788 266,033 489,904 285,571 495,334 299,422
Total 107,245 725,273 31,556,070 53,539 503,850,691
2016 Total 750,821 775,475 794,756
Calorific value (GJ) 4,309,710 25,520 1,056,750 2,704 1,813,842
(Please note that this report does not include the scope 3 or fugitive emission sources and only lists major emission sources.)
Total 105,765 924,907 36,602,945 58,943 539,830,818 Protection CH.4 Environmental
2017
Calorific value (GJ) 4,250,229 32,522 1,225,759 2,977 1,943,369
Product Carbon Emissions (by year) Unit: Tons CO 2 e
Total 104,191 746,901 42,313,241 50,997 566,014,106
2018 400,000 334,085 2016
Calorific value (GJ) 4,186,968 26,263 1,416,986 2,575 2,037,628 349,220
350,000 324,343 2017
300,000 274,369 308,517 2018
Greenhouse Gas Management 250,000 237,472
200,000 167,021 CH.5 Friendly
164,129 161,896
150,000 Workplace
Flat glass energy consumption Glass container energy consumption 100,000
intensity(GJ/Ton) intensity(GJ/Ton) 50,000
11.5 15 0 Flat Glass Fiberglass Glass Container CH.6
11.0 10.98 11.93 11.99 11.81
10.5 10.19 10 Care
10.0 9.59 Flat Glass GHG Emission Intensity Glass Container GHG Emission Intensity Community
9.5 5 (Ton of CO2e/ Flat Glass(ton)) (ton of CO2e/Flat Glass(ton))
9.0 1.3 1.5
8.5 0 1.2 1.16 1.16 1.16 1.14
2016 2017 2018 2016 2017 2018 1.1 1.09 1.0
1.0 1.04 0.5
0.9 0
2016 2017 2018 2016 2017 2018
086 // 2018 TAIWAN GLASS IND. CORP. Corporate Social Responsibility Report // // 2018 TAIWAN GLASS IND. CORP. Corporate Social Responsibility Report // 087